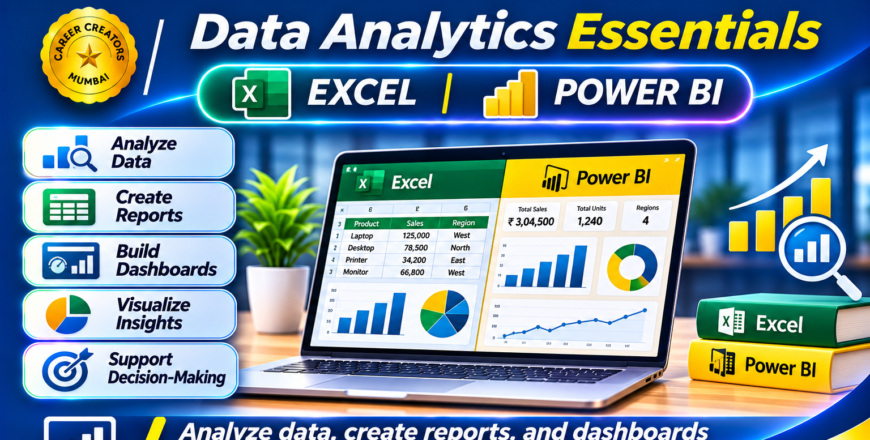
The Data Analytics Essentials course is designed to help students develop practical skills in analyzing, organizing and interpreting business data using Microsoft Excel and Power BI.
Businesses generate large volumes of data through sales, purchases, customer activities, employee operations and financial transactions. Analyzing this information helps organizations understand performance, identify trends and make better decisions.
This course focuses on practical data analysis techniques, spreadsheet management, reporting and dashboard development.
1. Introduction to Data Analytics
Understanding data analytics.
Importance of data in business.
Types of business data.
Understanding structured datasets.
Introduction to data-driven decision-making.
2. Microsoft Excel for Data Analysis
Organizing and formatting datasets.
Working with formulas and functions.
Logical functions.
Lookup functions.
Text and date functions.
Sorting and filtering.
Conditional formatting.
Data validation.
3. Data Cleaning & Preparation
Identifying duplicate records.
Correcting inconsistent information.
Removing unnecessary data.
Managing missing values.
Preparing datasets for analysis.
Combining and organizing data.
4. Advanced Excel Analysis
PivotTables.
PivotCharts.
Grouping and summarizing data.
Data analysis techniques.
What-if analysis fundamentals.
Preparing professional reports.
5. Introduction to Power BI
Understanding Business Intelligence.
Introduction to Power BI Desktop.
Importing data from Excel and other sources.
Working with datasets.
Understanding Power Query.
Cleaning and transforming data.
6. Data Visualization & Dashboards
Creating charts and visualizations.
Designing interactive reports.
Working with filters and slicers.
Understanding dashboard layouts.
Creating professional business dashboards.
Presenting analytical findings.
7. Practical Data Analytics Projects
Sales Performance Analysis.
Purchase Analysis.
Customer Analysis.
Employee Performance Analysis.
Inventory Analysis.
Business Performance Dashboard.
By the end of this course, students will be able to organize, clean and analyze datasets using Excel and Power BI.
They will understand how to prepare reports, create visualizations and develop interactive dashboards that help businesses monitor performance and make informed decisions.
Course Category: Data Analytics & Business Intelligence
Software Covered:
Microsoft Excel
Advanced Excel
Microsoft Power BI
Power Query
Skills You Will Develop:
Data organization
Data cleaning
Excel data analysis
Advanced formulas
PivotTables and PivotCharts
Power BI reporting
Data visualization
Dashboard development
Practical Projects:
Sales Analysis Dashboard
Purchase Analysis Report
Employee Performance Dashboard
Customer Analysis Report
Inventory Dashboard
Business MIS Dashboard
Suitable For: Commerce students, graduates, MIS executives, accountants, office professionals, business managers and aspiring data analysts.
Prerequisites: Basic computer knowledge and introductory Excel skills are recommended.